BOSTON, MA —August 12, 2025—Toast (NYSE: TOST), the all-in-one digital platform built for restaurants, released its latest Restaurant Trends Report, providing insight into the state of the U.S. restaurant industry through an analysis of aggregated data from selected cohorts of restaurants and in select U.S. states on the Toast platform, which serves approximately 148,000 restaurant locations as of June 30, 2025. This report also includes quarterly tipping data from Q2 2025.
Key takeaways
How restaurants are performing so far this summer compared to last year
How are restaurants performing this summer compared to last year? To see changes, Toast compared preliminary same-store transaction data from June 1, 2025, through July 15, 2025. (Yes, we know that summer didn’t officially start until June 20, but for many in the U.S., the start of summer is before the solstice.) We then compared this data to transaction data from the same restaurants from June 2, 2024, to July 16, 2024, to ensure both time periods covered similar days of the week. All restaurant types were included in this analysis, and Toast used a cohort of same-store customers that were on the platform from April 1, 2024, through July 15, 2025.
Overall, the restaurants Toast tracked are showing strong performance so far this summer. Total transactions were up slightly, and guests ordered a similar number of items per ticket. Zooming in, Toast identified 20 summer destination cities to compare their performance this year with that of the previous year. The list of cities was identified before the analysis.
City summer hot spots
Positive Growth in Coastal Cities: Several East Coast coastal cities, particularly in Florida, experienced the highest year-over-year growth in restaurant transactions. Naples, FL, saw the most significant increase at 8%, followed by the Portland Area, ME, at 5%. Charleston, SC, and Miami Beach, FL, also showed notable transaction growth at 3%.
Varied Performance in Major Cities: Performance was mixed among major cities. Chicago, IL, and New York City, NY, experienced modest transaction growth of 4% and 2% YoY, respectively. Other major cities, such as Washington, DC, and Boston/Cambridge, MA, saw more subdued results, with Boston/Cambridge showing no change and Washington, DC, having a slight decrease of 1% compared to last year.
Transaction Declines in Several Cities: A number of cities across different regions of the country saw a decrease in restaurant transactions. The most significant declines were in Denver, CO (-5%), St. Petersburg, FL (-4%), and Las Vegas, NV (-3%).
Geographic Contrasts: There were notable differences in performance within states. In Florida, for example, Naples and Miami Beach showed strong positive growth, while St. Petersburg and Sarasota had either decreases or no change. California cities, including San Diego and Santa Monica, also showed a decrease in transactions compared to last year.
What's affecting restaurant performance this summer?
Several factors may be impacting restaurant performance this summer, including inflation, discretionary spending, a decline in international summer travelers, and inclement weather. While it’s challenging to pinpoint exactly what’s impacting restaurants, a few examples stood out when examining daily activity.
Portland's stellar performance was in spite of the intense summer heatwave they experienced on Tuesday, June 24, 2025. That day, the Portland, ME area experienced a significant decline (-38%) in restaurant transactions compared to the same day of the week the previous year. Local ABC affiliate WMTW reports that the city of Portland had an extreme heat wave, with temperatures hitting 99 degrees, a new daily high.
Another rainy Saturday in Boston: On Saturday, June 7, 2025, restaurants in Boston and Cambridge, MA, experienced a 24% decline in transactions compared to the same Saturday in 2024. Boston-area residents will recall that this was a particularly cold and rainy Saturday in June, with temps hitting a high of 67 degrees and the area receiving about an inch of rain. However, on Saturday, June 8, 2024, the high temperature was 81 degrees, with no precipitation and mostly clear skies.
On Wednesday, June 11, 2025, Miami Beach experienced an 84% increase in restaurant transactions compared to Wednesday, June 12, 2024. The culprit was likely weather again: Miami Beach experienced significant flooding on June 12, 2024, with a daily total rainfall of over six inches. Wednesday, June 11, 2025, was dry with a high temperature of 73 degrees.
Las Vegas, on the other hand, has been grappling with lower hotel occupancy rates. Experts attribute the decline primarily to a drop in international visitors. While it’s hot in the desert in the summer months, Las Vegas relies heavily on international tourists, even in the brutal temperatures.
State-by-state summer transaction count comparisons
Zooming out to the state level, same-store summer restaurant transaction count performance was mixed: 24 states experienced growth in transactions, 13 remained flat, 13 states and Washington, D.C. declined compared to the same time period last year.
Alaska Leads: Alaska saw a 5% surge in summer restaurant transactions, with Maine and South Dakota close behind at 4% growth each.
Regional Dips: States like Alabama, Arizona, Colorado, Iowa, Nebraska, Nevada, and West Virginia experienced a 2% decline in transactions.
East Coast Stability: East Coast states generally show positive or stable performance, contrasting with some Midwest and Western areas.
States that ordered the most seafood, burgers, lemonade, fries, and hot dogs

Food Orders Across America: A State-by-State Look (Compared to National Average)
We've crunched the numbers to see which states are ordering significantly more of their summer favorites per restaurant location, relative to the national average on Toast. Here's a breakdown of some intriguing food trends across the U.S.
Seafood: Coastal states truly embrace their proximity to the ocean. Rhode Island ordered 164% more seafood items per restaurant location compared to the national average, followed by Louisiana (+154%) and Delaware (+128%). Unsurprisingly, states in the Midwest and Western United States show the lowest seafood order rates.
Burgers: The Pacific states are big on burgers. Hawaii ordered 72% more burgers per restaurant location than the national average, with Alaska (+64%) and Washington state (+52%) also showing high demand.
Fries: When it comes to the classic side, Hawaii (+59%), Utah (+48%), and California (+47%) are ordering significantly more fries per restaurant location compared to the national average. If you do get fries in Utah, don’t forget the fry sauce — a combo of mayo and ketchup that’s popular in the state — though there’s debate on where it was invented.
Hot Dogs: Nevada leads the nation in hot dog orders, with a 130% increase per restaurant location compared to the national average. West Virginia (+88%) and Georgia (+81%) also show strong preferences for hot dogs.
Lemonade: For lemonade orders, Mississippi (+38%), Nevada (+37%), and Massachusetts (+36%) ordered the most per restaurant location compared to the national average. Notably, Arizona, despite having lemonade as its state drink, ordered 13% fewer lemonades compared to the national average. Maybe they have lemonade at home?
The State of Tipping in America
Some bad news for full-service restaurant workers: Average full-service restaurant tips fell to 19.1% in Q2 2025, the lowest level Toast has seen in seven years. This is down from an average of 19.4% in Q1 2025. Tips at quick-service restaurants remained flat in Q2 2025 at 15.8% when compared to Q1 2025.
What could be driving the trend? The debate on tipping in the U.S. has been a persistent topic for several years and has recently garnered increased attention with legislative changes at the state, local, and national levels.
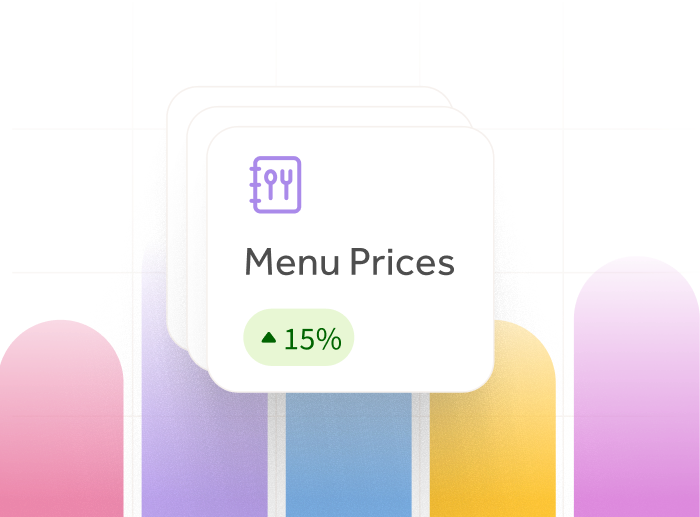
The rise of "tipflation" and increased tipping opportunities across industries has been said to lead to "tipping fatigue," ultimately sparking a backlash against tipping. Inflation in recent years can also affect tipping. As menu prices rise, guests may feel less inclined to tip on top of a larger bill.
For another consecutive quarter, Delaware remained the best state overall for tipping, with a total average tipping percentage of 21.4% in Q2 2025, down from 22.1% in Q1 2025.
California is again at the bottom of the list for overall tips in Q2 2025, averaging 17.2%, down from 17.3% in Q1 2025.
About the Restaurant Trends Report:
The Restaurant Trends Report, powered by Toast, uncovers key trends across the restaurant industry through aggregated sales data from a selection of cohorts of restaurants on the Toast platform, which has approximately 148,000 locations as of June 30, 2025. This information is provided for general informational purposes only, and publication does not constitute an endorsement. Toast does not warrant the accuracy or completeness of any information, text, graphics, links, or other items contained within this content. Individual results may vary. Toast does not guarantee you will achieve any specific results if you follow any advice herein. It may be advisable for you to consult with a professional such as a lawyer, accountant, or business advisor for advice specific to your situation. The Restaurant Trends Report is not indicative of the operational performance of Toast or its reported financial metrics.